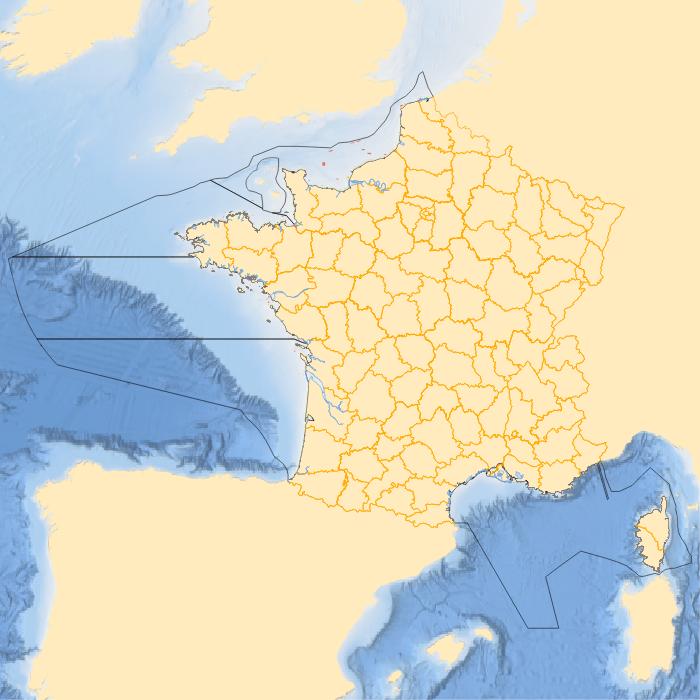
Catalogue PIGMA
Sea regions
Type of resources
Available actions
Topics
Keywords
Contact for the resource
Provided by
Years
Formats
Representation types
Update frequencies
status
Scale
Resolution
-
Water quality data according to the Water Framework Directive (WFD 2000/60/EC) for the surface water bodies of the Loire-Brittany and Seine-Normandy basins.
-
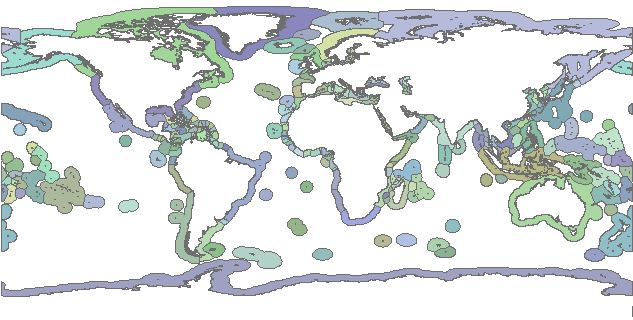
This dataset builds on previous versions of the world's EEZ. In version 9, the 200 nautical miles outer limit was completely recalculated using a higher resolution coastline as a normal baseline (ESRI Countries 2014) and straight baselines, where available. This dataset consists of two shapefiles: polylines that represent the maritime boundaries of the world's countries, the other one is a polygon layer representing the Exclusive Economic Zone of countries. This dataset also contains digital information about treaties, joint regime, and disputed boundaries.
-
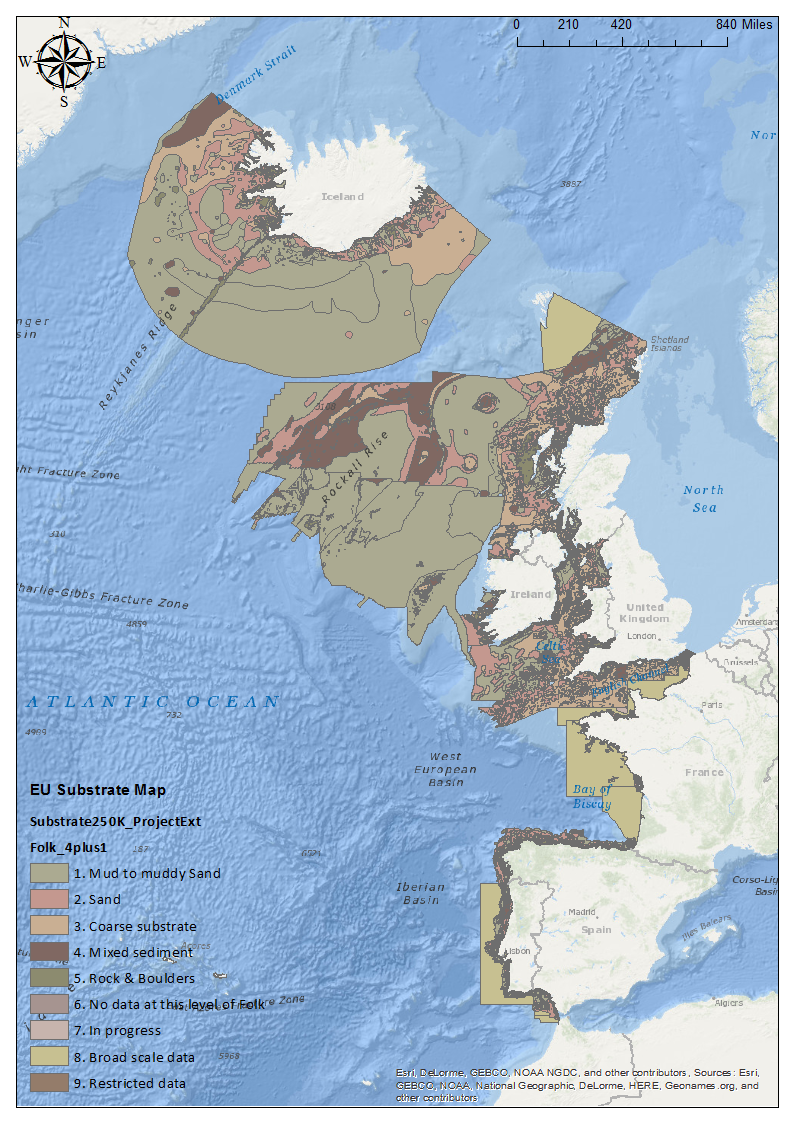
Sea bed sediment maps for the 4 marine sub-regions prepared as part of the initial evaluation of the MSFD (Marine Strategy Framework Directive).
-
Data from a number of different sources have been integrated to provide new perspectives on fishing activities. Vessel Monitoring Systems (VMS) record and transmit the position and speed of fishing vessels at intervals of two hours or less. Fishing time can be calculated from the VMS data and combining this parameter with vessel logbook data, maps of fishing effort and intensity at different spatial and temporal scales can be calculated. The statistical software package “R” is used to extract the required information then re-interrogated to produce maps of fishing effort or intensity per month and year. The use of Automatic Identification System (AIS) data was not considered as combining AIS data with fisheries logbook data would pose issues namely; the ability of the AIS system to be switched off, only mandatory on vessels > 15 meters in length, cost involved to purchase data, and confidentiality.
-
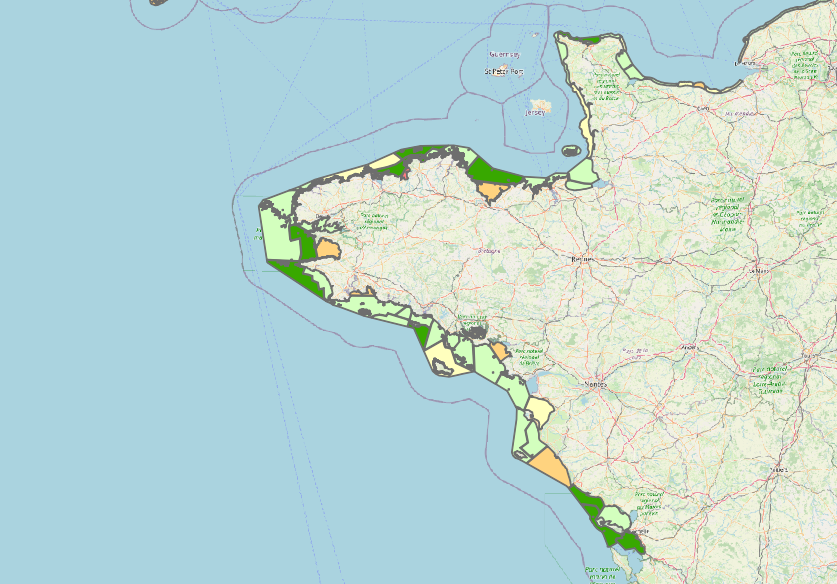
The Histolitt® coastline corresponds to the high tide line with an astronomic tidal coefficient of 120 and in normal weather conditions (no sea breeze and no low pressure systems likely to raise sea level). The Histolitt® coastline models this theoretical input as a series of 2D polylines. In mainland France, it is recommended to use the land-sea limit product which replaces this Histolitt® coastline. There is no land-sea limit in the French overseas areas for the moment.
-
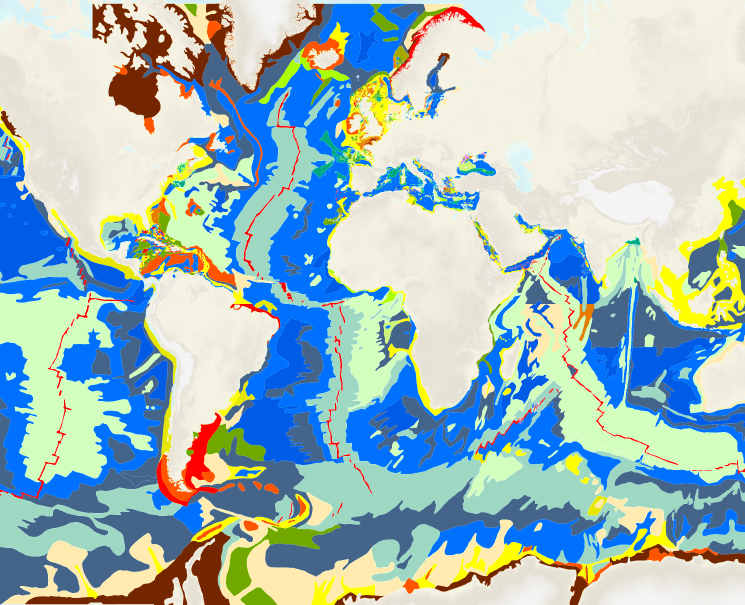
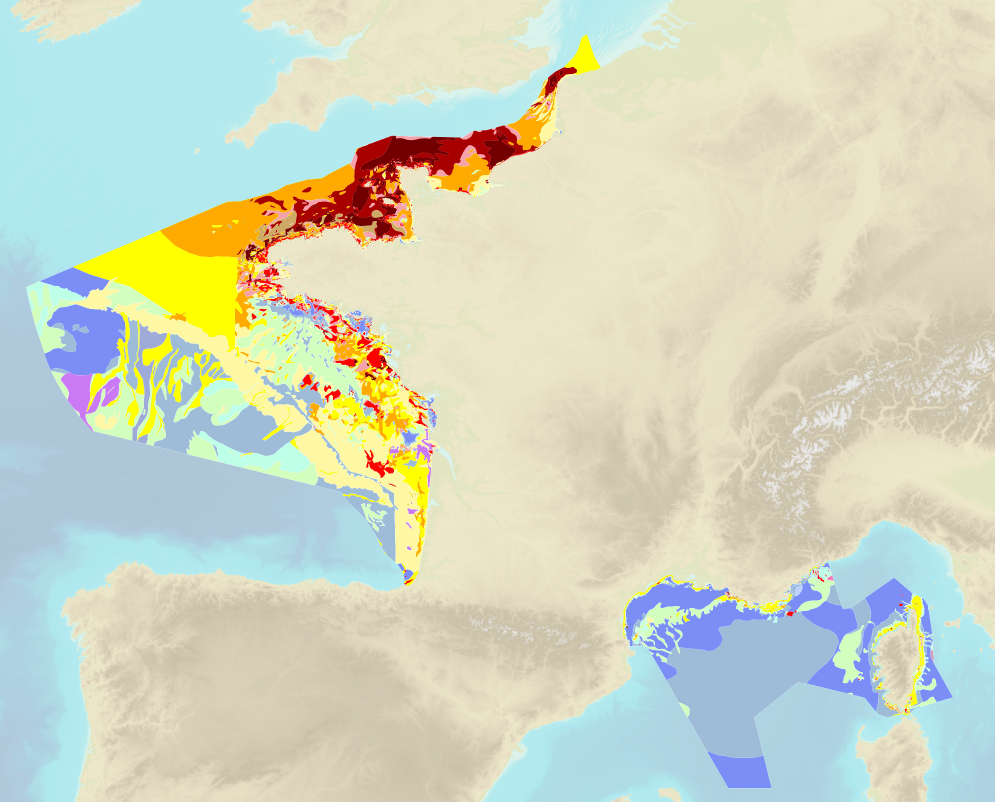
The “World Seabed Sediment Map” product contains geo-referenced digital data, describing the nature of the sediment encountered in different seas and oceans of the world. The objects are all surface areas and the description of an object includes in particular the nature of the sediment including rock-type bottoms.
-
The impact of fishing on benthic habitats has previously been investigated however; a conclusive classification of potentially sensitive habitats per gear type does not exist. Currently only qualitative estimates of fishery impact using Broad-scale habitat maps are possible. Here a sensitivity matrix using both fishing pressure (fishing Intensity) and habitat sensitivity is employed to define habitat disturbance categories. The predominant fishing activities associated with physical abrasion of the seafloor area are from bottom contacting towed fishing gear. The swept area of the aforementioned gear in contact with the seabed is generally considered a function of gear width, vessel speed and fishing effort (ICES. 2015). The varying characteristics of fishing gear, their interaction with the sea floor and species being targeted; provide scope for differing interactions with subsurface (infaunal) and surface (epifaunal) dwelling communities. An evaluation of the abrasion pressure and habitat sensitivity split into surface and subsurface pressure allows greater insight to the ecological effects. Fishing intensity was calculated annually and based on the area of sea floor being swept (or swept area ratio SAR) by gear type. Calculations are based on SAR’s of gear types per area, per year. Fishing pressure ranks and habitat sensitivity ranks obtained from WGSFD working group (01 WGSFD - Report of the Working Group on Spatial Fisheries Data 2015) can be incorporated within a GIS environment to existing ICES fisheries data to provide habitat disturbance maps (fishing pressure maps+ habitat sensitivity maps) ICES. 2015. Report of the Working Group on Spatial Fisheries Data (WGSFD), 8–12 June 2015, ICES Headquarters, Copenhagen, Denmark. ICES CM 2015/SSGEPI:18. 150 pp.
-
Data from a number of different sources have been integrated to provide new perspectives on fishing activities. Vessel Monitoring Systems (VMS) record and transmit the position and speed of fishing vessels at intervals of two hours or less. Fishing time can be calculated from the VMS data and combining this parameter with vessel logbook data, maps of fishing effort and intensity at different spatial and temporal scales can be calculated. The statistical software package “R” is used to extract the required information then re-interrogated to produce maps of fishing effort or intensity per month and year. The use of Automatic Identification System (AIS) data was not considered as combining AIS data with fisheries logbook data would pose issues namely; the ability of the AIS system to be switched off, only mandatory on vessels > 15 meters in length, cost involved to purchase data, and confidentiality.
-
The impact of fishing on benthic habitats has previously been investigated however; a conclusive classification of potentially sensitive habitats per gear type does not exist. Currently only qualitative estimates of fishery impact using Broad-scale habitat maps are possible. Here a sensitivity matrix using both fishing pressure (fishing Intensity) and habitat sensitivity is employed to define habitat disturbance categories. The predominant fishing activities associated with physical abrasion of the seafloor area are from bottom contacting towed fishing gear. The swept area of the aforementioned gear in contact with the seabed is generally considered a function of gear width, vessel speed and fishing effort (ICES. 2015). The varying characteristics of fishing gear, their interaction with the sea floor and species being targeted; provide scope for differing interactions with subsurface (infaunal) and surface (epifaunal) dwelling communities. An evaluation of the abrasion pressure and habitat sensitivity split into surface and subsurface pressure allows greater insight to the ecological effects. Fishing intensity was calculated annually and based on the area of sea floor being swept (or swept area ratio SAR) by gear type. Calculations are based on SAR’s of gear types per area, per year. Fishing pressure ranks and habitat sensitivity ranks obtained from WGSFD working group (01 WGSFD - Report of the Working Group on Spatial Fisheries Data 2015) can be incorporated within a GIS environment to existing ICES fisheries data to provide habitat disturbance maps (fishing pressure maps+ habitat sensitivity maps) ICES. 2015. Report of the Working Group on Spatial Fisheries Data (WGSFD), 8–12 June 2015, ICES Headquarters, Copenhagen, Denmark. ICES CM 2015/SSGEPI:18. 150 pp.
-